Friday, September 30, 2011

9-30 Class notes

Homework for 10-3:  page 38; items 17, 18, 19
9-30  Function composition

To compose functions is to put one function inside another function.

In our class example the shoe decision function was inside the legwear decision function.
Event was the first domain of inputs, and Legwear was the last range of outputs.

Function notation allows us to use substitution and the order of operations to evaluate composed functions.

f(g(x)) is read "f of g of x."  It does not mean f times g of x.

The variable x is inside g(x), and g(x) is inside f(x).

The order of operations tells us to begin with the inner most grouping symbol and to work outward.

Given g(x) = 2x - 1  and   f(x) = x^2,    f(g(x)) means substitute 2x -1 for the g(x) that is contained in f:

f(g(x)) = f(2x - 1) = (2x - 1)^2
f(g(x)) means get the result of g then square it


f(x) composed with g(x) is written (f small circle g)(x) which means f(g(x)).  g is inside f.

g(x) composed with f(x) is written (g small circle f)(x) which means g(f(x)).  f is inside g.

f(x) times g(x) is written (f(x))(g(x))

f(x) divided by g(x) is written  f(x)
                                             g(x)  

f(x) added to g(x) is written f(x) + g(x)

9-30 class notes and recent notes

Homework for Monday 10-3 is page 38; items 17, 18, 19.

Hint:  Make separate tables of values.   Find f(2), find g(2), find h(2)


Wednesday, September 28, 2011

9-28 Transformation description to absolute value equation

Homework for 9-29 Thursday is pages 34-36, items 7, 8, 9, 10, 11, 12

Pay attention to the units (dimensions) of the domain (input variable) and range (output variable).


Yesterday's homework notes page 32, 5a:

Start with y = | x |, the parent function.

Stretch vertically by a factor of 5  
>>>  Put something next to the absolute value bars which makes the slopes steeper

y = 5 | x |

Translate left 9 units
>>> Put something inside the absolute value bars which moves the graph to the left

y = 5 | x - (-9) |  which is written  y = 5 | x + 9 |

Translate down 23 units
>>> Put something outside the absolute value bars which moves the graph down

y = 5 | x + 9 | - 23


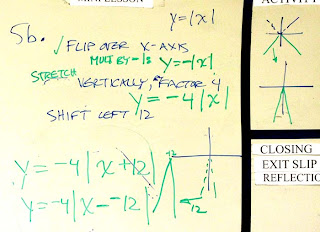
page 32, 5b:

Start with y = | x |, the parent function.

Reflect (flip) over the x-axis and stretch vertically by a factor of 4  
>>>  Put something next to the absolute value bars which flips and makes the slopes steeper

y = -4 | x |

Translate left 12 units
>>> Put something inside the absolute value bars which moves the graph to the left

y = -4 | x - (-12) |  which is written  y = -4 | x + 12 |

Tuesday, September 27, 2011

9-27 Class notes

Homework for 9-28:  page 32; items 1b, 3d, 4e, 5a

Procedure for solving equations and inequalities containing absolute value expressions:

Isolate the absolute value expression, the portion with the vertical bars.

Remove the absolute value bars by splitting the equation or inequality into two cases,
the original statemetn and its opposite.  Remember that when you generate the opposite of an inequality, hte direction of the > or < symbol changes.

Solve the two cases.  A graph of the solution combines the graphs of the two cases.  There could be open dots or closed dots.  There could be a segment of the number line or two split segments of the number line.

Monday, September 26, 2011

9-26 Homework quiz

9-26 Homework quiz.  Open book, open notes.  If you were absent today, please turn in your answers tomorrow.

page 4, item 5      M(t) =
page 5, item 7      D(m) =
page 7, item 16b   equation of boundary line
page 8, item 17a   inequality for number of meals
page 12, item 25    ________, ________, ________
page 14, item 3a    how many solutions?
page 14, item 3b    how many solutions?
page 14, item 3c    how many solutions?
page 17, item b
page 20, item 3
page 25, item b       identify domain and range
page 28, item 16a  describe the transformation
page 29, item b      describe the transformation
page 29, item c      describe the transformation
page 30, item b       solve | x + 1 | - 4 = -2

Homework for 9-27 Tuesday:
page 32; items 1a, 3c, 4a, 4c, 5b, 6a

Friday, September 23, 2011

9-23 Transformations and equations of absolute value functions

Homework for Monday 9-26:  p30-32; 17a, 17b, 17c, 17d, 18a, 18b

To solve an absolute value equation, first isolate the expression with the absolute value bars.

2 | x - 1 | - 5 = 1
2 | x - 1 |      = 6
   | x - 1 |      = 3

To simplify further, remove the bars by splitting the problem into a positive piece and a negative piece.  We do this because the absolute value function allows having two inputs, a vlaue and its opposite, for the same output.

x - 1 = 3          or         - ( x - 1 ) = 3  which is equivalent to x - 1 = -3
      x = 4          or                     x = -2

When an equation has an absolute value espression, it can have two solutions.
Some equations have one or no solutions.
If, after you simplify, the equation is false, then there is no solution.

Thursday, September 22, 2011

Transformations of absolute value 9-22 class notes

Homework for 9-23:  page 28-29, items 15a, 15b, 16a, 16b, 16c

Hints for homework:  Ask these questions:

Will the graph shift left or right?

Will the slopes of the pieces change?

Will the graph flip?

Will the graph shift up or down?

The parent absolute value function has two pieces, a left piece with a slope of -1 and a rightpiece with an opposite slope of 1.

The parent absolute value function's vertex is neither high or low because the point of the V is at (0,0).

The parent absolute value function's vertex is neither left or right because the point of the V is at (0,0).

If you subtract something (minus a positive) from x inside the absolute value bars, the graph shifts right
y = | x - 3 |                                       moves the parent function to the right.


If you add something (minus a negative) to x  inside the absolute value bars, the graph shifts left
y = | x - 2 | means y = | x - (-2) |      moves the parent function to the right.

If you multiply the absolute value part by a number, you change the slopes of the pieces.
item 11 from the homework, y = 3 | x | gives a graph with a sharper V

If you multiply the absolute value part by a negative number, you flip (invert) the graph.
y = -2 | x | gives a graph where the V points up instead of down

If you add something outside the absolute value bars, the graph shifts to a higher position
 y = | x | + 4                                     moves the vertex of the parent function up 4

If you subtract something outside the absolute value bars, the graph shifts to a lower position
 y = | x | - 4                                     moves the vertex of the parent function down 4

Wednesday, September 21, 2011

Absolute value 9-21 class notes

Homework for tomorrow 9-22 is page 27, items 11c, 11d, 12a, 12b.

EA1 graphing projects handed in tomorrow will be marked two days late.

If the graph of a piecewise function has an open dot that does not have a closed dot above or below it, that x-value is not included in the domain.

Clues to the domain are in the "if" conditions of the rules for the pieces.

The parent absolute value function y = | x | is a V pointing down shape with the corner at the origin (0,0).

Transformations to the absolute value function:

Add or subtract something from | x | means the graph is shifted up or down.


Multiply | x | by a positive number changes the steepness of the pieces.


Multiply | x | by a negative number flips the graph so the V points up.


Tuesday, September 20, 2011

Piecewise functions 9-20 class notes

Homework for 9-21 is page 25, items a, b, 7 and 8.

Yesterday and today we used easy, integer x's as inputs for a table of values for a piecewise function.  When an x makes a condition true, you use the associated rule to obtain the function or y- value.

If the condition has a "<" or ">" inequality without an equal sign, the graph of that piece will have an open dot at the end of the line, meaning you can't use the x-value for that position to create a y-value.  That piece of the function has no value, no x, no y, no orederd pair at that position.

If the condition has a "<" or ">" inequality including an equal sign, the graph of that piece will have a closed dot at the end of the line, meaning you use the x-value for that position to create a y-value.  That piece of the function has a definite value and ordered pair at that position.

When we make a table of values, we use integers so it's easier to plot the points on a grid.  When we connect the points with a line, it means there are many points besides our easy integers which satisfy the expression and the condition.  The domain and range of a function piece that is a line can have fraction and rational values, numbers in between the integers.  The domain and range are not limited to integers or easy points.  In item 5, the domain is "x is all real numbers", and the range is "y is all real numbers > 0."

We discussed why the graphs of piecewise functions look strange.  We are familiar with functions having a single rule, or expression, and one or no restrictions (conditions).  Each piece of a piecewise function can have a different shape: Two straight lines with different slopes, or a curve and a straight line.

Homework for 9-21 is page 25, items a, b, 7 and 8.

Quiz preparation:

Given the graph of a piecewise function, state the domain and range.

Given the expressions for a piecewise function, make a table of values and draw a graph.

Write a description of a piecewise function, describing where it changes from one piece to another, what the shapes of the pieces are, and what the domain and range are.

Monday, September 19, 2011

Cornell notes 9-19 functions and relations


EA 1 graphing project more hints 9-19

Solve for the coordinates of the vertex where red crosses green
Use the red equation in a system with the green equation
4x + 8y = 2400 and
9x + 3y = 1800                         
Hint - make the equations simpler; divide the 1st equation by 4

x + 2y = 600

and divide the second equation by 3.

3x + y = 600

Then use an "x =" or a "y =" to substitute, for example

x = 600 - 2y
make x tmporarily go away
3(600 - 2y) + y = 600     by substituting for x next to the 3
1800 - 6y + y = 600     by distribution
1800 - 5y = 600     by combining "y" terms
-5y = -1200     by subtracting 1800 from each side
y = 240    by dividing by -5 on each side
bring back x
x = 600 - 2(240)     by substituting for y in the earlier equation
x = 600 - 480
x = 120
the solution (x,y)  where these graphs intersect is (120, 240)
(120, 240) is a vertex for the feasible region


Solve for the coordinates of the vertex where green crosses blue
Use the green equation in a system with the blue equation
9x + 3y = 1800 and
9x + y = 1700                           
Hint - use a "y = " equation to substitute

y = 1700 - 9x     by subtracting 9x from each side
make y go away temporarily
9x + 3(1700 - 9x) = 1800     by substituting for y next to the 3
9x + 5100 - 27x = 1800     by distributing
-18x + 5100 = 1800     by combining "x" terms
-18x = -3300     by subtracting 5100 from each side
x = 183     by dividing each side by -18
bring back y
9(183) + y = 1700     by substituting 183 for x next to the 9 in the earlier equation
1647 + y = 1700     by multiplying
y = 53     by subtracting 1647 from both sides
        
the solution (x,y)  where these graphs intersect is (183, 53)
(183, 53) is a vertex for the feasible region

The calculated vertices for the feasible region are (0,0), (0, 300), (120, 240), (183, 53) and (200,)
These are the combinations of the numbers of games made at plant 1 and plant 2 that you will use to test in the objective function P = 90x + 70y.

Plug in all five ordered pairs and see which one gives you a maximum value for P.

Friday, September 16, 2011

EA 1 graphing project solve pairs of equations for two vertices

EA 1 graphing project solve pairs of equations for two vertices.

Directions for 5., revised.  You only need two ordered pairs, each from solving a system of 2 equations in 2 variables.

The dashed line is the boundary of the feasible region.  A solution for the red line and the blue line is not necessary because the intersection is outside the feasible region.

Solve for the coordinates of the vertex where red crosses green
Use the red equation in a system with the green equation
4x + 8y = 2400 and
9x + 3y = 1800                         
Hint - make the equations simpler; divide the 1st equation by 4
and divide the second equation by 3. Then use an "x =" or a "y =" to substitute
You will get (x,y) for this vertex

Solve for the coordinates of the vertex where green crosses blue
Use the green equation in a system with the blue equation
9x + 3y = 1800 and
9x + y = 1700                           
Hint - use a "y = " equation to substitute
You will get (x,y) for theis vertex

EA 1 graphing project 9-16 sample of student work


Partial work on the project by Miss Stacey

EA 1 Graphing Project class notes


Continue 2. by finding easy points for the two other constraints.

3.  Graph the three constraints using two easy points each.

4.   Make estimates for the coordinates of the intersections.  Miss Ledcke asked why do we read a graph and make estimates if the estimate is inexact and we won't use it.  The answer is that someone will give you a graph (picture information) and not give you the equations (math information), so you have to make an educated guess based on the information you have.  If you get more information, or if you can create more information by writing and solving a system of equations, you can get a more precise answer.

5.  In class we looked at where the red dashed line intersects the green dashed line.  That point is interesting because it's the solution of two equations, and it's the vertex of a feasible region.  We used substitution to find the coordinates of the point.


6. Compare this result with the estimate you made in 4.

7, 8, 9, 10, 11 build on the board diagram shown above.

Homework for Monday 9-19 is to finish the Embedded Assessment 1 graphing project.

Thursday, September 15, 2011

EA 1 graphing project and class notes

Math 11    Embedded Assessment 1    Graphing Project
Page 21.  We have determined that the profit objective function is P = 90x + 70y, where x is the number of games made at plant 1 and y is the number of games made at plant 2.  The table of hours used at each plant activity has given us three constraints, 9x + y LTE 1700, 9x + 3y LTE 1800, and
4x + 8y LTE 2400.
1.        On grid paper create axes in quadrant I with an x-scale of 600 and a y-scale of 1700.

2.        Find easy points (0,y) and (x,0) for the three constraint boundaries. 
9x + y = 1700, 9x + 3y = 1800, and 4x + 8y = 2400
You will get six easy points, two for each of the three lines.

3.       Graph the three constraint boundaries using different colors.

4.       Make estimates for the coordinates of the three intersections of the three lines.  You will get three ordered pairs.

5.        Take the constraint equations two at a time and use substitution or elimination to solve for x and y.  You will get three ordered pairs.

6.       Compare the results of 4. And 5.

7.       On grid paper create axes in quadrant I with an x-scale of 400 and a y-scale of 400.

8.       Look at the graph from 3. and look closely at the area where x < 400 and y < 400

9.       Use the intercepts from 2. and the points from 5. to draw an enlarged graph on grid 7.

10.   Shade the feasible region.

11.   Identify the vertices.

12.   Test the coordinates of the vertices in the profit function.  This means substitute the coordinates of a vertex into P = 90x + 70y to get a value for P.

13.   Determine which vertices or points give the greatest profit.

14.   Explain what this means for manufacturing game systems.


The homework for Friday 9-16 is to work ahead and finish this project.

Wednesday, September 14, 2011

Class notes 9-14 page 21 items 2, 3, 4, 5

Let x = the number of games made at plant 1,
Let y = the number of games made at plant 2.

In the columns of the table, write "times x" next to the numbers in the plant 1 column and write "times y" next to the numbers in the plant 2 column.

The rows of the table give the information needed to write the constraints:  There are only 1700, 1800, and 2400 hours available in the given rows of motherboard production, technical labor, and general manufacturing.
9x + 1y < or = 1700
9x + 3y < or = 1800
4x + 8y < or = 2400
These constraint expressions tell us how much of the resources we can USE.

We want to get as much as we can but we are limited in what we can use.

Graph the constraints using easy points (0,y) and (x,0)

9x + 1y < or = 1700        gives points at ( 0, 1700 ) and ( 188, 0 )

9x + 3y < or = 1800        gives points at ( 0, 600 ) and ( 200, 0 )

4x + 8y < or = 2400        gives points at ( 0, 300 ) and ( 600, 0 )


These lines form a polygonal feasible region.  The vertices (corners) interest us because one of them may give a maximum value for the profit objective function.

The profit objective function is P = 90x + 70y.  This expresses what we want to GET.

In class we estimated that one of the vertices was at (120, 240).  When we plug these quantities of gaming systems into the profit objective function, we get 90(150) + 70(250) = $27,600.

We tried another vertex ( 0, 300 ) in the profit objective function, getting 90(0) + 70(300) = $21,000.

We make more money at the point (120, 240), meaning we should make 120 games at plant 1 and 240 games at plant 2.

Try two other vertices to see if their coordinates give a higher profit.

Tuesday, September 13, 2011

Math 11 class notes Tuesday September 13

In class we worked through the first part of a system of 3 equations in 3 variables. We used substitution, and we could have used elimination, to make one variable "x" temporarily go away.  We got to 2 equations in two variables, y and z. 


From this point we can again use substitution or elmination to make another variable go away so we can get one equation in one variable to solve..  In real-world problems, systems larger than 3 equations in 3 variables use computers because of the number of calculations involved.  When you learn about matrices, you will be able to use a graphing calculator to more quickly solve such systems.

Homework for Wednesday 9-14, page 21, items 1, 2, 3, 4, 5.  Assign two variables, and write constraints as inequalities.  This assignment is like the one with Roy buying tickets and meals.

From previous classes:


Friday, September 9, 2011

Solving Systems of Equations 9-9

The graphing answer for the bell ringer showed that the two lines crossed in quadrant II.
The slope for the first equation was 2 (uphill) and the slope for the second equation was -4 (downhill)

When we solve a system of two equations in two variables without using graphs, why do we substitute twice?


When we solve a system of two equations in two variables without using graphs, why do we sometimes loof for or try to make terms that cancel each other out (such as 4x and -4x)?


When one of the equations already appears as an isolated "x =" or "y =", what method should you use?


The first part of solving a system of two equations in two variables is to temporarily make one of the variables go away.  You can use the _____________ method or the ____________ method to get one equation in one variable.

The second part of solving the system is to solve for one of the variables.


The third part of solving a system of two equations in two variables is to to bo back through the problem and _________________ what you found for one of the variables so you can bring back the other variable.


Write the solution of an independent and consistent system equations as an ordered pair, such as (-2, 5)


General approach for solving a system:  Make one variable temporarily go away so you have one equation, and solve it.  Use the result to back through the problem, plug it in to bring back the other variable.

Wednesday, September 7, 2011

Demand and Supply function graphs page 13, item 1, 9-7-2011

The Demand function has a slope of -0.7, so its graph is the one slanted downhill.
The Supply function has a slope of 1.5, so its graph is the one slanted uphill.

Homework for 9-8:  page 14, items 3 and 4, graphing a system of equations.

Vertex Theorem of Linear Programming page 12, item 25, 9-7-2011

Vertex Theorem of Linear Programming

If an ________________________ has a maximum or minimum solution, then that value occurs at one of

the ______________ of the _____________________ .


Increasing the value of the objective function moves its graph in parallel steps away from the origin, as we showed with the yardstick in class  When it reaches the vertex of the feasible region, that gives the maximum values for the x and y that solves the objective function and satisfies the constraints of the feasible region.
.


If an objective function has a maximum or minimum solution, then that value occurs at one of

the vertices (corners) of the feasible region.

Tuesday, September 6, 2011

Three inequalities form a polygonal region 9-6


Quiz Wednesday, September 6

You will be allowed to use class notes, Cornell notes, blog notes and a calculator.

Not allowed:  Springboard book, printouts from the blog.

Graph three inequalities and shade the polygonal region.

Describe the effect that introducing constraints has on a region in the coordiante plane.

Given a situation, write an inequality and draw a graph that represents the relationship.

Given a graph, write a linear equation.